At a glance
The verdict, and three of the 31 slides that come with it.
Major comments
19
Minor comments
6
Potential recommendation
Substantial revision
Example review
A complete review of a published report, exactly as the council produced it and then checked by us: the written review, the empirical checklist, the Word referee report and the discussion slide deck.
The document reviewed. Gender Equity Insights 2020: Delivering the Business Outcomes, published by the Bankwest Curtin Economics Centre and the Workplace Gender Equality Agency. We chose it because it is public, widely cited, and rests on regression evidence, which is where a careful review matters most.
How this review was made. One run of Refereely with the policy paper option, at the cost of one credit. Nothing was prompted or steered beyond uploading the PDF.
What we did afterwards. We checked every finding against the report's text and tables. The substance held up. We made nine small corrections, which are listed at the foot of this page, and the downloads include them. Every review carries the same advice: read it and edit it before you rely on it.
Please note. This is an AI-assisted assessment of a published document, not of its authors. If you are an author of the report and think anything here is inaccurate, tell us and we will correct it.
The verdict, and three of the 31 slides that come with it.
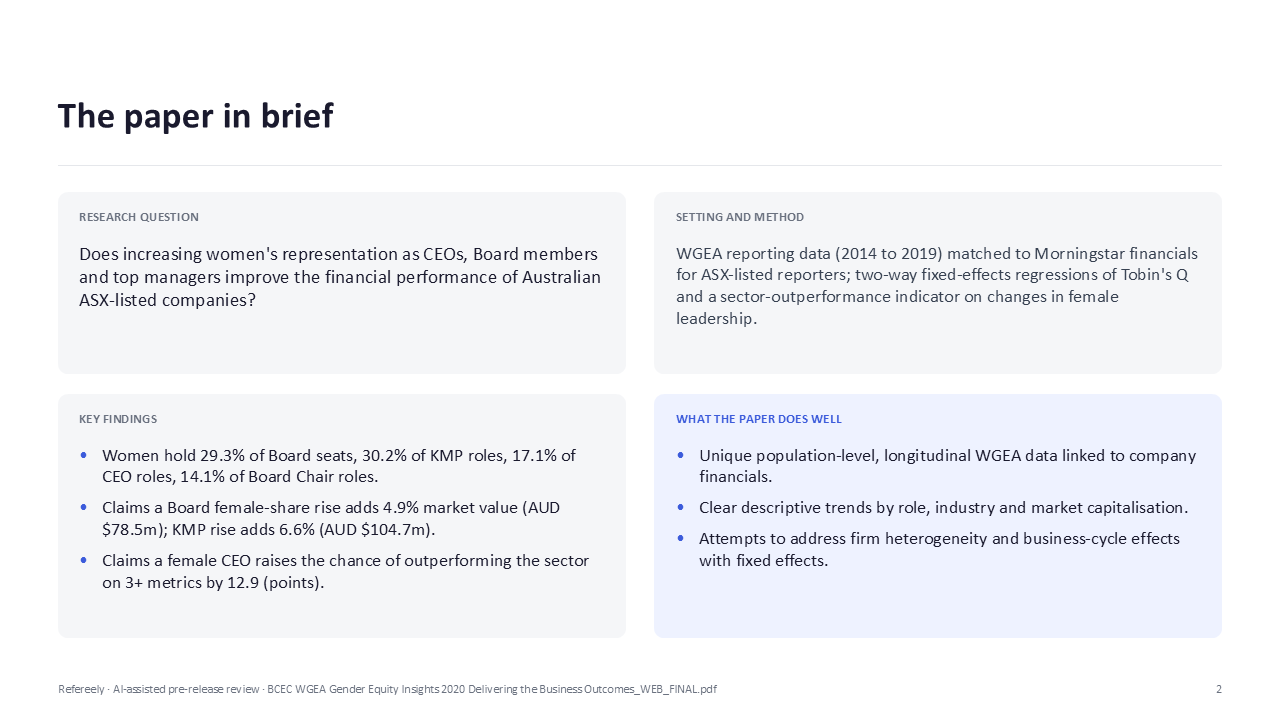
This BCEC|WGEA report uses six years of WGEA employer reporting (2014 to 2019) to describe trends in women's representation as CEOs, Board members and Chairs, and Key Management Personnel (KMPs). It then matches ASX-listed WGEA reporters to Morningstar financial data and estimates two-way fixed-effects regressions of Tobin's Q and a binary 'outperform the sector on 3+ of 6 metrics' indicator. It concludes that increasing female leadership causally raises market value by roughly AUD $78.5m to $104.7m for the average company. The descriptive material is valuable, and the longitudinal WGEA linkage is a genuine asset. However, the panel judges that the causal claim is not supported by the design as reported. The key regressors are undefined relative to the headline '10 percentage points or more' framing and are measured contemporaneously with outcomes. No standard errors, sample counts or robustness checks are shown. Several headline numbers are internally inconsistent: Table 2 signs and significance stars disagree with Table 3, and the Summary quotes USD figures as AUD and as 'per year'. The policy section does not translate the evidence into options a decision-maker could act on. The panel recommends substantial revision before the report is used to support policy or Board decisions.
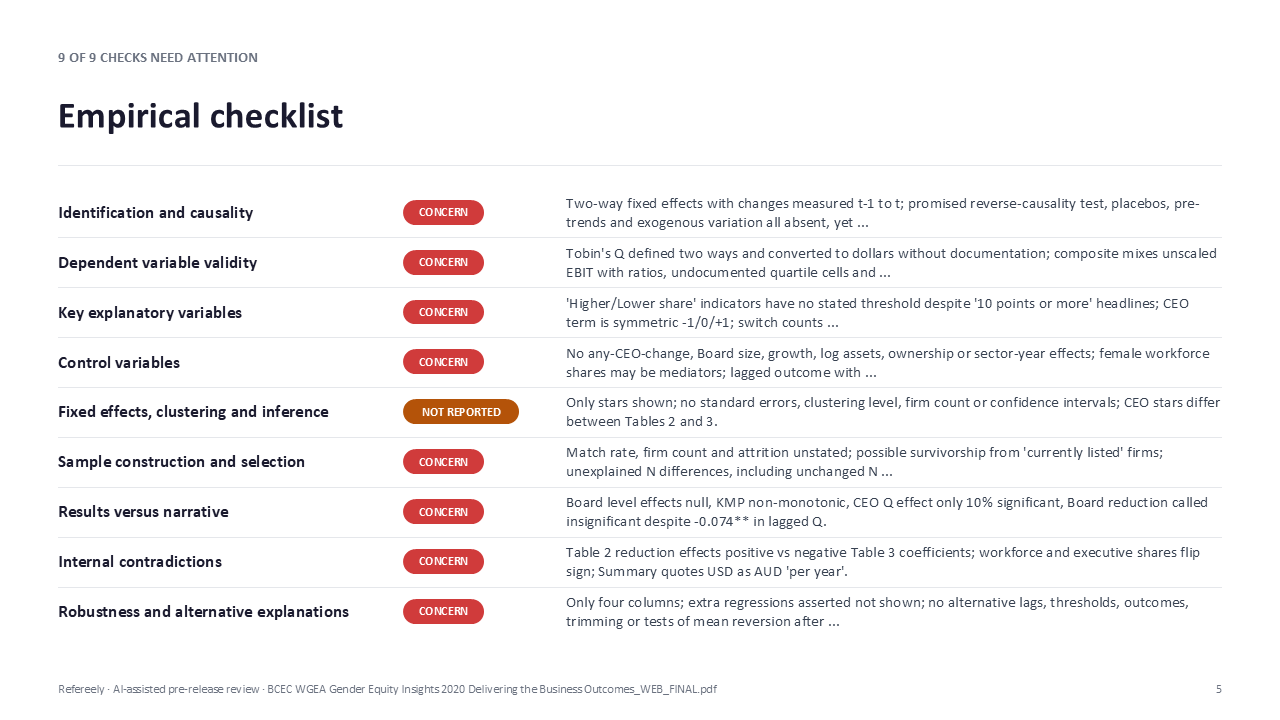
When a paper reports regressions, one reviewer must give a verdict on every item below. Nothing is skipped.
| Check | Assessment | Note |
|---|---|---|
| Identification and causality | Concern | Two-way fixed effects with changes measured t-1 to t; promised reverse-causality test, placebos, pre-trends and exogenous variation all absent, yet causal language throughout. |
| Dependent variable validity | Concern | Tobin's Q defined two ways and converted to dollars without documentation; composite mixes unscaled EBIT with ratios, undocumented quartile cells and missing-data rules. |
| Key explanatory variables | Concern | 'Higher/Lower share' indicators have no stated threshold despite '10 points or more' headlines; CEO term is symmetric -1/0/+1; switch counts unreported. |
| Control variables | Concern | No any-CEO-change, Board size, growth, log assets, ownership or sector-year effects; female workforce shares may be mediators; lagged outcome with fixed effects. |
| Fixed effects, clustering and inference | Not reported | Only stars shown; no standard errors, clustering level, firm count or confidence intervals; CEO stars differ between Tables 2 and 3. |
| Sample construction and selection | Concern | Match rate, firm count and attrition unstated; possible survivorship from 'currently listed' firms; unexplained N differences, including unchanged N after adding a lag. |
| Results versus narrative | Concern | Board level effects null, KMP non-monotonic, CEO Q effect only 10% significant, Board reduction called insignificant despite -0.074** in lagged Q. |
| Internal contradictions | Concern | Table 2 reduction effects positive vs negative Table 3 coefficients; workforce and executive shares flip sign; Summary quotes USD as AUD 'per year'. |
| Robustness and alternative explanations | Concern | Only four columns; extra regressions asserted not shown; no alternative lags, thresholds, outcomes, trimming or tests of mean reversion after turnover. |
Each comment says where in the report it applies and what the report does there, before raising the concern. Select a comment to open it.
Where: Modelling Strategy, p. 37; Key Findings, p. 42; Regression methodology, p. 54; Forewords, pp. 6-7; Executive Summary, p. 8
What the report does
The paper estimates regressions with firm and year fixed effects in which changes in female Board, KMP and CEO representation explain Tobin's Q and sector outperformance. It argues that relating 'prior changes' in female leadership to 'subsequent' outcomes identifies a causal effect, and that 'if the reverse is found not to be the case, then the direction of causality can also be determined'. It concludes the associations 'can legitimately be claimed as causal'.
The concern
Firm fixed effects remove only characteristics of a firm that do not change over time, and year effects remove only shocks common to all firms. Neither addresses time-varying confounders. Examples include a new strategy, restructuring, CEO or Board turnover, investor or activist pressure, capital raising, mergers, or improving prospects. Any of these could lead a firm both to appoint women and to be re-rated by the market. The reverse channel is also plausible: firms with rising valuations may recruit more directors. The paper itself identifies reverse causality as the key threat and says direction is established only if the reverse is ruled out, yet no reverse-direction regression is reported anywhere. No placebo test using future (lead) leadership changes is presented, nor any pre-trend or event-study evidence, instrument or quasi-experiment. The forewords and executive summary then tell business leaders and Boards that appointing women 'leads to' specific dollar gains, that this is 'tangible proof', and that leaders 'no longer have an excuse'. If the estimates are conditional associations, those dollar figures cannot be read as the return to an appointment decision, and the credibility of WGEA's use of the report is exposed if the claim is challenged.
From the report
"these associations can legitimately be claimed as causal." (p. 42); "And if the reverse is found not to be the case, then the direction of causality can also be determined." (p. 37)
Suggested revision
Report the reverse-direction regressions (changes in female leadership on lagged performance). Add placebo regressions of current performance on future leadership changes. Add an event-study around changes in Board or KMP gender composition showing pre-trends. Control for overall Board and KMP turnover so a 'new appointment' effect is separated from a 'female appointment' effect. Consider plausibly exogenous variation, such as the 2015 AICD 30% target interacted with pre-target Board composition. If these are not added, replace 'causal' with 'associated' or 'consistent with a causal effect' throughout, including the forewords, executive summary and pull quotes, and state the identifying assumptions explicitly.
Where: How to Measure Company Performance, p. 39; Regression methodology, p. 54; Table 3, p. 43; notes to Figures 11 and 13, p. 30 and p. 33
What the report does
p. 39 says the models 'include leadership changes in the previous two years'. The methodology note on p. 54 defines the change regressors as changes 'between t-1 and t', and Table 3 enters the CEO variable as HasFemaleCEO[t] minus HasFemaleCEO[t-1]. The figure notes refer to a 'two-year time interval'.
The concern
A change measured from t-1 to t, used to explain an outcome measured at t, ends in the same period as the outcome. It is concurrent with the outcome, not prior to it. The paper's argument for the direction of causality rests on temporal ordering, so contemporaneous changes undercut that argument directly. Tobin's Q is also forward-looking, so a market re-rating and a leadership change in the same year cannot be ordered. Three different descriptions of timing appear (previous two years; t-1 to t; a two-year interval in the descriptive figures), and the paper does not say how WGEA reporting snapshot dates align with the Morningstar financial years. Readers therefore cannot tell what period each regressor covers relative to the outcome.
From the report
"Levels and changes in the shares of female KMPs and Board members between t-1 and t" (p. 54); "we include leadership changes in the previous two years" (p. 39)
Suggested revision
Provide the estimating equation and a timing diagram showing, for each regressor, the WGEA measurement date, the financial year of the outcome, and the lag. Reconcile the p. 39, p. 54 and figure-note descriptions. Re-estimate with genuinely lagged changes (for example t-2 to t-1 explaining outcomes at t), separately from contemporaneous changes, and show how the estimated effect varies with lag length.
Where: Executive Summary, p. 9; Key Findings and Table 2, p. 41; Table 3, p. 43; Regression methodology, p. 54; WGEA Foreword, p. 6
What the report does
Every headline result is attributed to 'an increase of 10 percentage points or more' in female Board or KMP share. In Table 3 the corresponding regressors are categorical indicators labelled 'Higher share of female Board members', 'Higher share of female KMPs' and 'Lower share ...', against a base of 'no change'. The CEO regressor is the difference HasFemaleCEO[t] minus HasFemaleCEO[t-1].
The concern
No threshold defining 'higher', 'lower' or 'no change' is stated in Table 3 or the methodology note. If any increase counts as 'higher', the coefficient averages over small and large increases, and attributing it to a 10-point increase is unsupported. If a 10-point threshold was used, then increases under 10 points fall into the 'no change' base or an unstated category, which also changes the interpretation. On small Boards and KMP teams a single appointment can move the share by more than 10 points, and the share can change through the denominator (Board size) rather than appointments. Moreover, the change indicators enter alongside level bands (up to 25%, 25 to 33%, over 33%), so each change coefficient is a partial effect holding the level band fixed, not the total effect of an increase. The CEO difference variable takes the values -1, 0 and 1. It therefore forces the effect of moving to a female CEO to equal, with opposite sign, the effect of moving away from one, and it is unclear how many such transitions occur. These are exactly the magnitudes a Board or regulator would act on.
From the report
"Change in Board gender representation [base = no change] ... Higher share of female Board members 0.110***" (Table 3, p. 43); "an increase of 10 percentage points or more in female representation on the Boards" (p. 9)
Suggested revision
Define each change category mathematically (threshold, interval, base) in the Technical Notes and in Table 3. Report counts of firm-years and distinct firms in each category, Board and KMP team sizes, and female CEO transitions in each direction. Estimate a continuous change specification and report the implied effect of a 10-point change with a confidence interval, plus alternative thresholds. Model CEO transitions to and from a female CEO with separate indicators. Compute total effects that combine level and change terms. If no 10-point threshold was used, remove the phrase from the Executive Summary, forewords and Table 2.
Where: Table 2, p. 41; Table 3, p. 43; Key Findings text, p. 42; Executive Summary, p. 9
What the report does
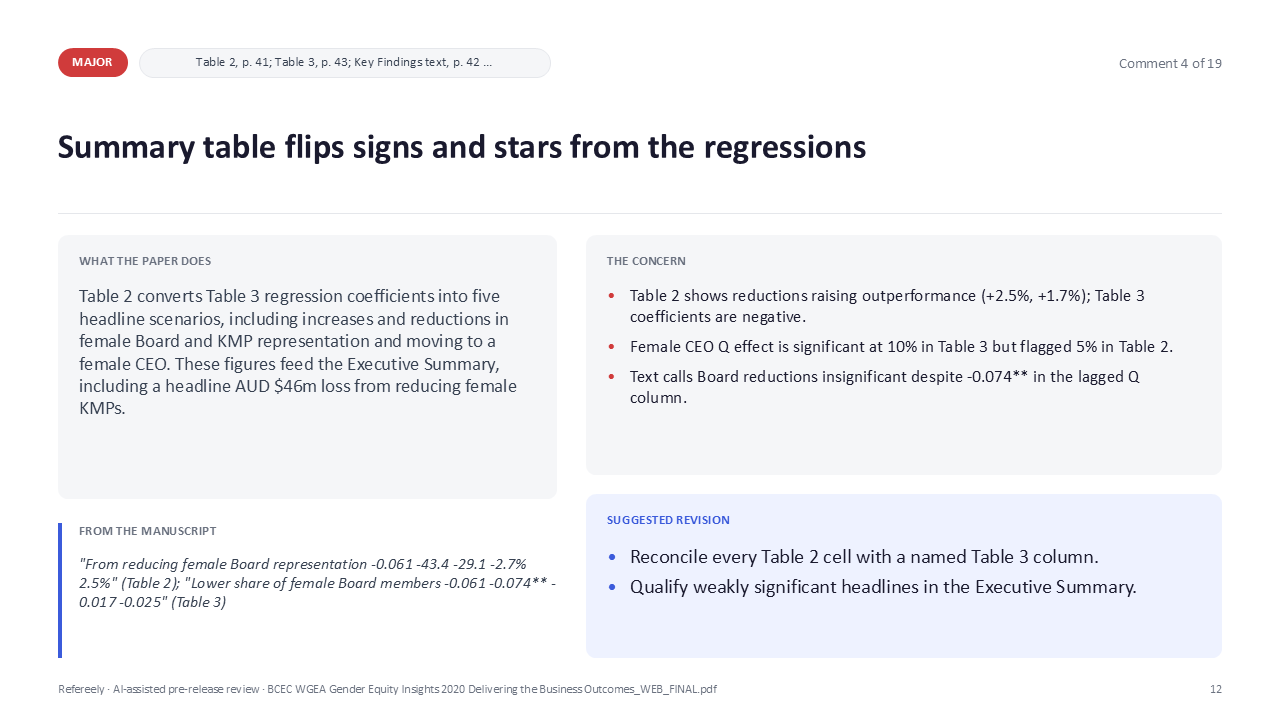
Table 2 translates Table 3 coefficients into market-value and outperformance effects for five scenarios, including reductions in female Board and KMP representation. The text on p. 42 says the Board reduction findings 'were not statistically significant', and the Executive Summary headlines the KMP reduction effect (-2.9%, AUD $46m).
The concern
Table 2 reports that reducing female Board representation raises the likelihood of outperformance by 2.5% and reducing KMP representation raises it by 1.7%. Table 3 shows negative coefficients for these terms in both outperformance columns (-0.017 and -0.025 without the lagged outcome; -0.025 and -0.028* with it). A reader of Table 2 alone would conclude that cutting women from leadership improves the chance of outperforming, which contradicts both the model and the narrative. The female CEO effect on Tobin's Q is 0.112, marked significant only at 10% (*) in Table 3, but its dollar equivalent (AUD $79.6m) is marked at 5% (**) in Table 2. The text calls the Board reduction effect insignificant, yet the lagged Tobin's Q column shows -0.074**. In the other direction, the KMP reduction effect headlined in the Executive Summary is significant only at 10% in one specification and insignificant with the lag. The tables never say which Table 3 column feeds Table 2; the numbers match the column without the lagged outcome, but this is not stated. Sign and significance errors in the summary table weaken confidence in every derived number.
From the report
"From reducing female Board representation -0.061 -43.4 -29.1 -2.7% 2.5%" (Table 2); "Lower share of female Board members -0.061 -0.074** -0.017 -0.025" (Table 3)
Suggested revision
Correct the signs of the reduction rows in Table 2 and carry significance flags across consistently. State which Table 3 column supplies each Table 2 cell. Correct the text on Board reductions to reflect the -0.074** lagged estimate. Flag in the Executive Summary that the reduction effects are imprecise and specification-dependent, and that the female CEO Q effect is significant only at 10% in the column used.
Where: Summary and Discussion, p. 46; compare Table 2, p. 41 and Executive Summary, p. 9
What the report does
The concluding summary restates the market-value gains from increasing women across CEO, Board and senior leadership roles for an average-sized organisation.
The concern
The range quoted, 'AUD $52m and AUD $70m', matches the USD column of Table 2 (USD $52.6m, $53.3m, $70.2m), not the AUD column (AUD $78.5m, $79.6m, $104.7m). The sentence also adds 'per year'. Table 2 reports a change in market value, which is a stock: a one-off revaluation of the firm, not a recurring annual flow of profit. Readers could wrongly accumulate the gain over several years. This is the most quotable sentence in the conclusions, so the combined currency and annualisation errors will be repeated by media and stakeholders.
From the report
"delivers added company market value of between AUD $52m and AUD $70m per year for an average sized organisation." (p. 46)
Suggested revision
Replace with 'between AUD $78.5m and AUD $104.7m (USD $52.6m to $70.2m)' and delete 'per year'. Explain that these are one-off changes in market value at the mean firm, and distinguish market valuation, annual earnings and cumulative returns throughout.
Where: Table 2 and notes, p. 41; How to Measure Company Performance, p. 39; Glossary, p. 52
What the report does
Table 2 converts estimated changes in Tobin's Q (for example 0.110) into percentage and dollar changes in market value 'at the average company market value and average value of common equity'. p. 39 defines Q as market capitalisation plus total debt over total assets; the Glossary gives 'Total Market Value / Total Asset Value'.
The concern
The conversion formula, the baseline values (average market value, assets, Q, common equity), the sample over which they are averaged, and the exchange rate are not reported, so the dollar figures cannot be reproduced. Back-calculation (78.5 divided by 0.049) implies an average market value of about AUD $1.6bn. That is a mean of a distribution likely dominated by a few very large ASX50 firms, so the 'average company' is not a typical listed company, and the gain for a typical firm could be much smaller. Mapping a change in Q, defined with market capitalisation plus debt in the numerator and assets in the denominator, to a change in equity market value requires assumptions that debt and assets are unchanged. The note's reference to common equity does not obviously match the stated Q definition. The two Q definitions may be compatible if 'total market value' includes debt, but the paper should say so. Outlier treatment (winsorising or trimming) is not stated. No confidence intervals accompany the dollar values. These figures are the most cited outputs, appearing in the WGEA foreword, the Executive Summary and the pull quotes.
From the report
"Projections are presented at the average company market value and average value of common equity for Australian ASX-listed companies." (Table 2 notes, p. 41)
Suggested revision
Publish the exact conversion formula, the sample means and medians of market value, Q and assets, the exchange rate and its date, and the assumptions about debt and assets. Use one Q definition consistently and state outlier treatment. Report effects at the median firm alongside the mean, with confidence intervals derived from the coefficient uncertainty. Consider estimating log Q, or log market value controlling for log assets, so percentage effects are direct. Describe the amounts as illustrative.
Where: Table 3 and notes, p. 43; Table 2, p. 41; Regression methodology, p. 54
What the report does
Table 3 reports point estimates with significance stars, N (1,286; 1,274; 1,444; 1,444) and R-squared for four columns. Its note says only that parameters are flagged at 1%, 5% and 10%. Table 2 gives dollar effects without intervals.
The concern
Standard errors, t-statistics and confidence intervals are not reported anywhere, and the covariance estimator is not described. In particular, the paper does not say whether standard errors are clustered by firm. With about five annual observations per firm and persistent outcomes and regressors, repeated observations are unlikely to be independent; unclustered errors would generally understate uncertainty. The number of distinct firms (clusters) is not reported. Several headlines already rest on 10% or 5% significance (for example the female CEO Q effect at 10%), so the method matters. Many related tests are run across four columns and several leadership variables with no discussion of multiple testing, which raises the risk of emphasising whichever results happen to be significant.
From the report
"Parameters are flagged as significant (sig.) at 1% (***), 5% (**) and 10% (*)." (Table 3 notes, p. 43)
Suggested revision
Report firm-clustered standard errors (or wild-cluster bootstrap if clusters are few) and 95% confidence intervals for every coefficient, stating the covariance estimator. Report the number of firms. Give confidence intervals for each Table 2 dollar and probability effect. Identify the primary hypotheses and report a multiple-testing sensitivity check for the leadership results.
Where: Table 3, p. 43; Executive Summary, p. 8; Summary and Discussion, pp. 46-47
What the report does
Alongside the change indicators, Table 3 includes the level of female Board and KMP share in bands (zero as base; up to 25%; 25% to 33%; more than 33%). The Executive Summary states 'More women at the top means better company performance', and the Summary says firms that increase women leaders are 'systematically found to outperform'.
The concern
For KMPs, only the 25% to 33% band is significant (0.204***, 0.241***, 0.171***, 0.171***); the over-33% band is small and insignificant (0.033, -0.003, 0.052, 0.054), and the up-to-25% band is insignificant. None of the Board level bands is significant, and several are negative in the lagged specifications (for example -0.067 for over 33% in lagged Q). So once firm effects are controlled for, firms with more women in leadership show no consistent performance premium, while firms that recently changed composition do. Insignificant estimates are not proof of no effect, but this pattern does not support a monotonic 'more is better' message and is at least as consistent with a transitory effect of any composition change (for example Board refresh) as with a sustained effect of female leadership. The paper never discusses these results. They also bear directly on the 30% to 40% targets discussed on p. 47: if gains plateau or vanish above a third, the case for a particular target differs.
From the report
"More than 33% 0.033 -0.003 0.052 0.054" (female KMP level, Table 3); "More women at the top means better company performance" (p. 8)
Suggested revision
Add a paragraph interpreting the level coefficients and explaining how they square with the change effects, with tests between categories. Test whether change effects persist two and three years later and whether they reflect any Board or KMP turnover regardless of gender. Explore continuous and nonlinear specifications. Revise the Executive Summary and Summary wording to reflect what the regressions show.
Where: Table 2, p. 41; Key Findings, p. 42; Executive Summary, p. 9
What the report does
The binary 'outperform the sector on 3+ metrics' outcome appears to be estimated as a linear probability model with fixed effects. Coefficients of 0.060, 0.058 and 0.129 are reported as a '6.0%', '5.8%' and '12.9% increase in the likelihood' of outperforming.
The concern
In a linear probability model a coefficient of 0.060 is a 6.0 percentage-point change in probability, not a 6.0% relative increase. The descriptive base rate of outperformance is roughly 8% to 21% (Figures 8 and 9), so a 6-point rise is a relative increase of 30% or more, and the 12.9-point CEO effect would be very large. Because the base rate is not given alongside the estimates, non-technical readers cannot judge magnitude, and the mixture of percentage-point effects with percentage market-value effects invites misquotation. The estimator itself is not explicitly named.
From the report
"the appointment of a female CEO has driven a 12.9% increase in the likelihood of outperforming the sector on three or more metrics" (p. 9)
Suggested revision
State the estimator. Relabel the effects as percentage-point changes and report the sample base rate of outperformance beside each. Consider a conditional logit as a robustness check.
Where: Modelling Strategy, p. 37; What Happens to Company Performance, p. 29; Table 3, p. 43; Women in Leadership and Industries, pp. 19-20; Executive Summary, p. 8
What the report does
WGEA reporters are matched to Morningstar data 'by ASX codes'. The descriptive change analysis covers companies 'currently listed' on the ASX. Table 3 reports N of 1,286 and 1,274 (Tobin's Q) and 1,444 (Outperform, with and without lag). The problem-scale statistics (29.8% of organisations with no women on Boards; 27.5% with no female KMPs) come from all WGEA reporters.
The concern
The paper does not report how many distinct firms are in the panel, the match rate, how subsidiaries reporting separately to WGEA are mapped to listed parents with consolidated accounts, how many firms enter or exit (for example through delisting), or how the matched sample compares with all ASX firms or all WGEA reporters. If the regression sample is restricted to currently listed firms, failed or delisted firms are excluded, raising survivorship concerns. N differs between the Q and Outperform models without explanation, and adding a lagged outcome leaves the Outperform N unchanged, which is mechanically odd. Year effects are shown only for 2016 to 2019, so the base year and treatment of 2014 are unclear. With firm fixed effects, the female CEO coefficient is identified from firms that switch CEO gender, and the number of such switches is not given; given low female CEO rates (about 6 ASX50 firms in 2019), it may be small. Finally, the Executive Summary juxtaposes all-reporter problem statistics with ASX-only effect sizes, which matters for any recommendation aimed at non-listed employers.
From the report
"matched by ASX codes to the subset of companies in the WGEA dataset that were also listed on the Australian Securities Exchange (ASX)" (p. 37); "N 1,286 1,274 1,444 1,444" (Table 3)
Suggested revision
Add a sample-flow table by year: WGEA reporters, matched firms, match rules for corporate groups, exclusions and missing financial data, entry and exit, and observations dropped per specification. Report distinct firms and the number of switches in each leadership variable, including CEO transitions. Explain the N differences and the base year. Compare included firms with the wider ASX and WGEA populations, and restrict generalisation to WGEA-reporting ASX firms.
Where: Table 3, columns 'Tobin's Q (with lag)' and 'Outperform (with lag)', p. 43; Regression methodology, p. 54; footnote 10, p. 39
What the report does
Two Table 3 columns add a lagged dependent variable (Tobin's Q[t-1] at 0.231***; Outperform sector[t-1] at -0.100***) to models with firm fixed effects over 2014 to 2019, 'as a further device to capture state dependence'. Footnote 10 states that the two-way fixed-effects model 'is equivalent to a first-differenced regression specification' and that additional regressions give 'the same empirical findings'.
The concern
With about five usable periods per firm, the within (demeaning) transformation makes the lagged dependent variable correlated with the transformed error, biasing its coefficient (Nickell bias), and the bias can spread to the other coefficients. The negative and highly significant lagged outperformance coefficient is consistent with this bias, though it could also reflect genuine mean reversion; the paper does not discuss either. As a result, agreement between the static and dynamic columns is weaker evidence of robustness than implied. Separately, fixed-effects (within) and first-difference estimators coincide only when there are two periods; with six years they generally differ, so footnote 10 is incorrect and obscures what variation identifies the results. The additional regressions it mentions are not shown.
From the report
"The two-way panel fixed effects model is equivalent to a first-differenced regression specification" (footnote 10, p. 39); "Outperform sector [t-1] - - - -0.100***" (Table 3)
Suggested revision
Either drop the lagged dependent variable from the fixed-effects models or estimate the dynamic models with an Arellano-Bond or system GMM estimator, reporting instrument counts and validity diagnostics. Report the distribution of usable panel lengths. Correct footnote 10 and publish the additional specifications it refers to in an appendix.
Where: Gender Diversity and Company Performance, p. 25; How to Measure Company Performance, p. 39; Regression methodology, p. 54; Figures 10 and 12, p. 29 and p. 32
What the report does
A firm 'outperforms' if it is in the top quartile of its industry sector on at least three of six metrics: return on equity (ROE), return on assets (ROA), Tobin's Q, EBIT, sales per employee and dividend yield. This binary indicator is the dependent variable in half of the regressions.
The concern
Several construction choices are unstated: the benchmark universe (matched ASX sample or wider), whether quartiles are computed per year, minimum cell sizes per sector-year (some sectors may have very few matched firms, making quartile cut-offs noisy), and how firms with missing components are treated (missing metrics change how hard the 3-of-6 hurdle is). The components are mechanically or economically related: ROE and ROA share net income; Tobin's Q appears in both outcome measures; high dividend yield can reflect a falling share price, working against Q; high ROE can reflect leverage. EBIT is an unscaled level, so top-quartile EBIT partly reflects firm size rather than performance. The quartile and 3-of-6 thresholds are not tested. Because the measure is relative to sector peers, it also cannot show economy-wide gains if all firms adopt the same practice. ROA is one of the six components but is omitted from the metric-by-metric Figures 10 and 12 without explanation.
From the report
"Companies are considered to outperform the sector when the company performance metric is above the 75th percentile within the relevant industry sector." (p. 39)
Suggested revision
Document the full construction in the Glossary: benchmark population, year-specific quartiles, sector-year cell sizes and missing-component rules. Scale EBIT by assets or sales. Report regressions for each component separately, for 2-of-6 and 4-of-6 thresholds, and leave-one-out composites, along with component correlations. Add ROA to Figures 10 and 12 or explain its omission.
Where: Linking Female Representation to Business Outcomes, pp. 36-43; How to Measure Company Performance and footnote 10, p. 39
What the report does
The paper says the lag structure 'can be adjusted' and footnote 10 says additional regressions 'generate the same empirical findings', but only the four columns of Table 3 are shown.
The concern
No results are shown for alternative lag lengths, alternative change thresholds or continuous changes, continuous outcomes such as ROA and ROE, sector-by-year effects, outlier-trimmed or winsorised samples, exclusion of financial firms (whose Tobin's Q and leverage are not comparable), or subperiods. Alternative explanations are not addressed, including mean reversion after CEO or Board turnover, investor-pressure confounding and growth-firm valuation. A single set of specifications, with robustness asserted but not shown, cannot support the confident causal and dollar claims the report makes.
From the report
"These generate the same empirical findings to those reported here." (footnote 10, p. 39)
Suggested revision
Add a robustness appendix covering alternative lags, thresholds and continuous changes, component outcomes, sector-by-year effects, winsorising or trimming, exclusion of financial firms, subperiods, and the placebo and event-study tests requested above. Present headline results as a range across specifications.
Where: Key Findings, p. 42; Table 3, p. 43; Modelling Strategy, p. 37
What the report does
The regressions control for the shares of female workers, executives and senior managers. p. 42 explains the negative coefficient of female workforce share on outperformance by reference to organisations 'where profitability and growth are less of an imperative, for example in education or in the health services sector'.
The concern
Female workforce share is positive for Tobin's Q (1.225; 1.347*) but negative for outperformance (-1.059**; -1.072**). Female executive share is negative for Q (-0.015; -0.025*) but positive for outperformance (0.240*). Only the negative workforce result is discussed. The education and health explanation is a cross-sector, time-invariant story, but industry is absorbed by firm fixed effects and outcomes are benchmarked within sector, so it cannot explain a within-firm association. These shares are also plausibly outcomes of the Board and KMP changes being studied, so including them may absorb part of the effect of interest (bad controls) and change the meaning of the headline coefficients. Sign flips on the same construct across the two outcomes sit uneasily with a claim that female representation robustly improves performance.
From the report
"companies with a high overall share of female workers are less likely to outperform the sectors on three or more measures - potentially signifying organisations where profitability and growth are less of an imperative, for example in education or in the health services sector" (p. 42)
Suggested revision
Report and discuss both signs for both variables. Remove the education and health conjecture unless tested, or replace it with a within-firm interpretation, and investigate industry-by-year effects. Show headline results with these potentially mediating controls excluded.
Where: What Happens to Company Performance When You Change the Share of Women in Leadership?, Figure 11, p. 30 and Figure 13, p. 33
What the report does
The paper reports average two-year percentage changes in performance ratios by direction of change in female leadership. It highlights a 142.4% rise in ROE for firms increasing female Board share, an 80.2% ROE change for firms increasing female KMPs, and sales per employee growth of 18.2% versus 5.1%.
The concern
ROE, EBIT and dividend yield can be zero, negative or near zero, so ordinary percentage changes can be arbitrarily large or change sign meaninglessly; the paper does not say how these cases are handled. Values such as -53.7 and +80.2 in Figure 13 are consistent with unstable denominators. Figure 13 labels ROE '(x100)' without explanation. No group sample sizes, medians or measures of dispersion are reported, and no adjustment for sector composition, initial performance or regression to the mean is made. The text then draws a behavioural inference ('female top-tier managers may have a greater focus on productivity gains'), which revenue growth comparisons cannot identify. Readers may take these large raw figures as effect sizes.
From the report
"This suggests that female top-tier managers may have a greater focus on productivity gains when entering into these positions." (p. 33)
Suggested revision
State the growth formula and the handling of zero or negative bases. Report observation counts, medians, interquartile ranges and winsorised means, or use changes in levels and percentage-point changes for ratios. Add uncertainty intervals and composition-adjusted comparisons. Explain the ROE scaling. Label the productivity-focus explanation as an untested hypothesis or remove it.
Where: WGEA Foreword, p. 6; BCEC Foreword, p. 7; Executive Summary, pp. 8-9; Summary and Discussion, p. 47
What the report does
The WGEA foreword presents increasing female leadership as one simple action that improves finances 'regardless of the size of your firm or the industry in which you operate'. The executive summary and conclusion extend this to 'greater productivity and greater profitability' and say more women 'will deliver higher dividends'.
The concern
No interaction between leadership changes and firm size or sector is estimated; the firm-size dummies in Table 3 shift only the intercept. The claim of uniform effects is therefore untested. The regressions model only Tobin's Q and the composite outperformance indicator; dividends, productivity and profitability are not separately modelled, and the composite can improve without any one of them improving. The descriptive section itself reports mixed results across individual indicators (for example for Tobin's Q and sales per worker). The forewords are the parts decision-makers are most likely to rely on, so they cannot be exempt from the report's evidential limits.
From the report
"bolster your financial performance regardless of the size of your firm or the industry in which you operate" (p. 6); "more women as key decision makers will deliver higher dividends for a company" (p. 47)
Suggested revision
Either estimate interactions by size band and broad sector or remove the 'regardless of size or industry' claim. Align the forewords, executive summary, pull quotes and conclusion with the population, outcomes and uncertainty actually analysed, removing guaranteed-return language. Distinguish the equity case from the evidence on specific financial returns.
Where: Summary and Discussion, 'What does this mean for policy and practice?', p. 47 (footnotes 20-21); WGEA Foreword, p. 6; About WGEA, p. 2; Introduction, p. 10
What the report does
The policy discussion lists countries with 30% or 33% Board targets or quotas and others legislating 40%, credits a 2018 target with Australian progress, cites a 30% 'critical mass', and says companies must 'commit to specific actions'. The WGEA foreword urges leaders to 'act now'. The Introduction recalls the series' earlier findings on pay-gap audits reported to executives, employer-funded parental leave and on-site childcare.
The concern
The report addresses business leaders and names broad actions (appointing female CEOs, improving Board diversity), but it does not translate its evidence into options a minister, regulator or agency could weigh. It does not compare the voluntary status quo, enhanced disclosure, ASX 'if not, why not' targets, and legislated quotas in terms of mechanism, legal authority, cost, compliance burden, effects on smaller firms, or evidence from quota jurisdictions. It does not say who should act (ASX Corporate Governance Council, ASIC, WGEA, Boards), by when, or how progress would be monitored. Its estimates concern voluntary changes, not mandated quotas, and this distinction is not drawn. The paper's own level results (insignificant above 33%) bear on target design but are not used. The earlier-series findings, arguably the most actionable content, are not turned into recommendations. The report also does not explain why profit-seeking firms forgo gains of AUD $78.5m to $104.7m if they are real; it mentions a 'glass ceiling' and work-family policies but offers no diagnosis linking barriers (information, appointment networks, discrimination) to types of intervention.
From the report
"But lifting the share of women in leadership can only happen if companies focus on the goal of achieving gender equity in progression and commit to specific actions to drive change." (p. 47)
Suggested revision
State whether the report is an evidence report or a policy proposal. If proposing action, add an Implications section with an options table (status quo, enhanced disclosure, voluntary targets, quotas) covering mechanism, responsible body, cost and burden, and supporting domestic and international evidence. Name actors, timelines and monitoring indicators WGEA could track annually. Turn the earlier-series findings (audits with Board reporting, funded parental leave of 13 weeks or more, childcare) into practice recommendations. Briefly set out candidate reasons for persistent under-representation and the intervention each implies. If no intervention is evaluated, limit policy conclusions explicitly.
Where: Introduction, pp. 10-11; Summary and Discussion, pp. 46-47; p. 33
What the report does
The introduction notes that study results 'vary substantially' and gives one sentence to a null result (Carter et al. 2010). The discussion then says the business case 'is clear' and offers mechanisms: cognitive diversity, women running businesses 'more democratically', stakeholder orientation and corporate social responsibility, and the 'Lehman Sisters' study.
The concern
Contrary evidence is treated briefly, and the paper does not engage with null or negative findings, including evidence from quota-based studies, or explain why its Australian results differ. Matsa and Miller (2013) is cited for cognitive variety; the cited 2018 McKinsey report, which disclaims causality, is used as the template for the composite measure. Mechanisms are asserted rather than tested in this report's data, for example the claim that the Lehman Sisters result 'was due to the stakeholder-orientation of its female directors' and that women 'run businesses more democratically'. Several cited sources (Carter et al. 2010, Lins et al. 2015, Matsa and Miller 2014) are missing from the reference list, so readers cannot follow up the contrary evidence or proposed mechanisms. Sceptical stakeholders, such as directors' institutes and investors, need a fair balance of evidence.
From the report
"Other research has found no significant links between gender diversity and company financial performance." (p. 11); "This was due to the stakeholder-orientation of its female directors" (p. 47)
Suggested revision
Add a balanced evidence section summarising supportive, null and negative findings, including quota-based studies, and explain how these results reconcile. Label mechanisms as hypotheses from the literature, distinguishing those tested in cited research from those merely proposed and those not measured here. Complete the citations.
Where: Linking Female Representation to Business Outcomes: Specification, p. 40; Regression methodology, p. 54; Table 3, p. 43
What the report does
The time-varying controls are capital intensity, leverage, depreciation over property, plant and equipment (age of capital stock), employee-size bands, and female workforce and manager shares, plus firm and year fixed effects.
The concern
Several factors a referee would expect are absent. Growth opportunities (sales growth, R&D or intangibles) are central in a Tobin's Q regression. Firm size is measured only by employee bands, not log assets or log market capitalisation. Board size and independence are omitted, although adding a woman often enlarges the Board. Most importantly, there is no indicator for any CEO change regardless of gender. Without it, the female CEO variable is confounded with CEO turnover itself, which is often triggered by poor performance and followed by mean reversion. Ownership concentration and institutional ownership, which drive both diversity pressure and valuation, are omitted. With only year effects, sector-specific cycles (for example mining commodity cycles versus health) can confound sector-relative trends; sector-by-year effects would address this. Each omission plausibly biases the headline coefficients. Verification confirmed these controls are absent; whether each is necessary is a methodological judgement.
From the report
"Other time-varying controls include a series of financial indicators that potentially relate to company performance" (p. 40)
Suggested revision
Add at least an any-CEO-change indicator, Board size, log assets, sales growth and sector-by-year fixed effects, then ownership measures where available. Report how the headline coefficients move as each is added.
Smaller points of accuracy and presentation.
Where: Summary and Discussion, p. 47; Does Company Size Matter?, Figure 6 and text, p. 22
What the report does
p. 22 attributes the 30% ASX200 Board target to the Australian Institute of Company Directors (2015). p. 47 credits an 'Australian Securities Commission 2018 target' and compares the share of ASX 201-500 companies reaching 30% with the ASX 200.
The concern
The 28.9% figure is the average share of female Board members in ASX200 companies (Figure 6), not the share of companies at or above 30%. Comparing it with '16% of ASX 201-500 companies' is therefore not like-for-like; the two measures can differ substantially. The ASX 201-500 grouping appears nowhere else, and no source is given for the 16%. The target is attributed to different bodies on the two pages. Foreign quota examples (footnote 21) give no dates, coverage or binding status, though voluntary targets and statutory quotas are different instruments. This is the passage linking findings to policy instruments, so accuracy matters.
From the report
"Only 16% of ASX 201-500 Australian companies have achieved or surpassed this figure compared with 28.9% of companies in the ASX 200." (p. 47)
Suggested revision
Report the share of companies at or above 30% for each size band from WGEA data, using the Figure 5 to 7 categories, with sources. Attribute the target consistently and correctly. Add a compact table of international measures with date, coverage, binding status and enforcement.
Where: Summary and Discussion, p. 47; Executive Summary, p. 8; BCEC Foreword, p. 7
What the report does
The conclusion says Australia should not wait 'another 80 years' for CEO parity, and the Executive Summary and Foreword frame the findings as central to COVID-19 recovery.
The concern
No projection, calculation or source supports the 80-year figure; extrapolating Table 1's +1.4 point rise in female CEOs over 2014 to 2019 would be one basis but is not stated. The COVID-19 framing has no link to the 2014 to 2019 analysis, and nothing shows the estimated effects hold during a recession. Unsupported figures in conclusions invite challenge.
From the report
"Australia should not have to wait another 80 years for a woman to be as likely as a man to hold a company CEO position." (p. 47)
Suggested revision
Show the projection and its assumptions or remove the figure. Present COVID-19 as context only, unless crisis-period evidence is used explicitly.
Where: Glossary and Technical Notes, pp. 52-53; How to Measure Company Performance, p. 39
What the report does
The Glossary gives formulas for each metric used in the charts and composite outcome.
The concern
The dividend yield formula is displayed inverted (Share Price over Annual Dividend), although the text correctly defines it as dividend relative to share price; if implemented as displayed, rankings would differ materially, and if it is a layout error it still impairs reproducibility. Tobin's Q is defined two ways (p. 39 versus p. 52). EBIT is expanded as 'Earnings before Income and Tax' on p. 39. ROE is described as both use of 'reinvested earnings' and use of 'assets'. Sales per worker is described as measuring 'the quality and efficiency of a firm's workforce', but it also reflects prices, capital intensity and outsourcing, so it is a revenue-based proxy, not labour productivity.
From the report
"Dividend Yield = Share Price / Annual Dividend" (as displayed, p. 52)
Suggested revision
Correct the dividend formula and confirm the calculation code. Use one Q definition, fix the EBIT expansion and ROE description, and relabel sales per worker as a revenue proxy.
Where: Key Findings, p. 42; Table 3, p. 43; Figure 13, p. 33
What the report does
The text says capital intensity is 'a strong and significant driver' of performance and that 'a 10% increase in the maturity of capital stock' raises outperformance likelihood by 'around 7%'.
The concern
All four capital-intensity coefficients are strongly negative (-2.559***, -1.282***, -2.339***, -2.366***), but the text omits the direction and offers no economic explanation. The 0.705 coefficient on depreciation/PPE implies about 7 percentage points only for a 0.10 absolute change in the ratio, not an unspecified 10% relative increase; units and baseline are missing, and it is unclear whether a higher ratio means older or younger capital. Leverage and size coefficients are insignificant, which should be described as inconclusive rather than as no effect. The positive female workforce effect on Q is not mentioned.
From the report
"a 10% increase in the maturity of capital stock is associated with an increase of around 7% in the likelihood" (p. 42)
Suggested revision
State signs, units and baselines for control effects in percentage points; explain the negative capital-intensity relationship.
Where: WGEA Foreword, p. 6; Introduction, p. 10; Women in Leadership, Table 1, p. 14 and text pp. 15-16; Does Company Size Matter?, p. 21; Glossary, p. 52
What the report does
Several figures are restated in narrative text.
The concern
The foreword says 'one third' of Boards have no women; the data show 29.8%. Coverage is 'more than 4.3 million' employees on p. 10 but 'approximately 4 million' on p. 52. Other Managers growth is +3.3 points in the text but +3.2 in Table 1. p. 16 says management tiers rose 'by an average of 1-2 percentage points annually', but Table 1's five-year changes (+5.6, +4.2, +4.1, +3.6) imply roughly 0.7 to 1.1 points per year. Table 1's 'restricted to full-time workers' note is applied to Board members and Chairs without explanation. On p. 21, the claim that six ASX50 firms with a female CEO is 'more than double the number of non ASX200 companies' cannot be checked without denominators.
From the report
"In fact, one third of these Boards still have no female representation at all." (p. 6)
Suggested revision
Reconcile all narrative figures with tables, give annualised changes correctly, state denominators by size band, and clarify how directors are counted under the full-time restriction.
Where: Introduction, pp. 10-11; footnotes on p. 14, 39, 46-47; References, p. 58
What the report does
The report cites literature in the text and footnotes and supplies a reference list.
The concern
Carter et al. 2010, Klein 2017, Lins et al. 2015, Matsa and Miller 2014, Tobin and Brainard 1976 and Kaldor 1966 are cited but not listed. Years and spellings conflict (McKinsey 2018 vs Hunt et al. 2019; Capezio and Mavisakalyan 2015 vs 2016; Deszo vs Dezsö; Ragunatham vs Ragunathan). Besley et al., Farrell and Hersch, and Huang and Kisgen are listed but not cited.
From the report
"5 Capezio and Mavisakalyan 2015." (p. 14)
Suggested revision
Reconcile all citations with the reference list.
Every review compares the citations in the text with the reference list.
The review was generated in one run. These are all the changes we made before publishing it.
The first and last of these were faults in Refereely itself, not in the reviewers' judgement. Both have since been fixed: page references now follow the numbers printed in the document, and the reference check no longer flags reports, working papers, or papers whose database record carries a different year.
Start with a free first look: your paper in brief, one concern in full and a preview of your slides, in under a minute. One credit then buys the full review, the Word referee report and the slide deck.
One credit buys the full review, the Word referee report and the slide deck. It takes a few minutes.
Get a free first lookGet started See pricing